Debugging PHP 502 and 504 Errors
Not all issues come with a wall of red text.
Published on
-/- lines long
I was working on a PHP site that suddenly started returning 502 Bad Gateway and 504 Gateway Timeout errors after an update that worked fine locally and on the staging server.
We were using Kirby(opens in new tab), a file-based CMS running on PHP(opens in new tab), behind an nginx(opens in new tab) reverse proxy, over Amazon EFS(opens in new tab), a network file system which makes server redundancy possible.
At first, I thought the issue was in EFS, because the errors were accompanied by strange charts in the file system dashboard:
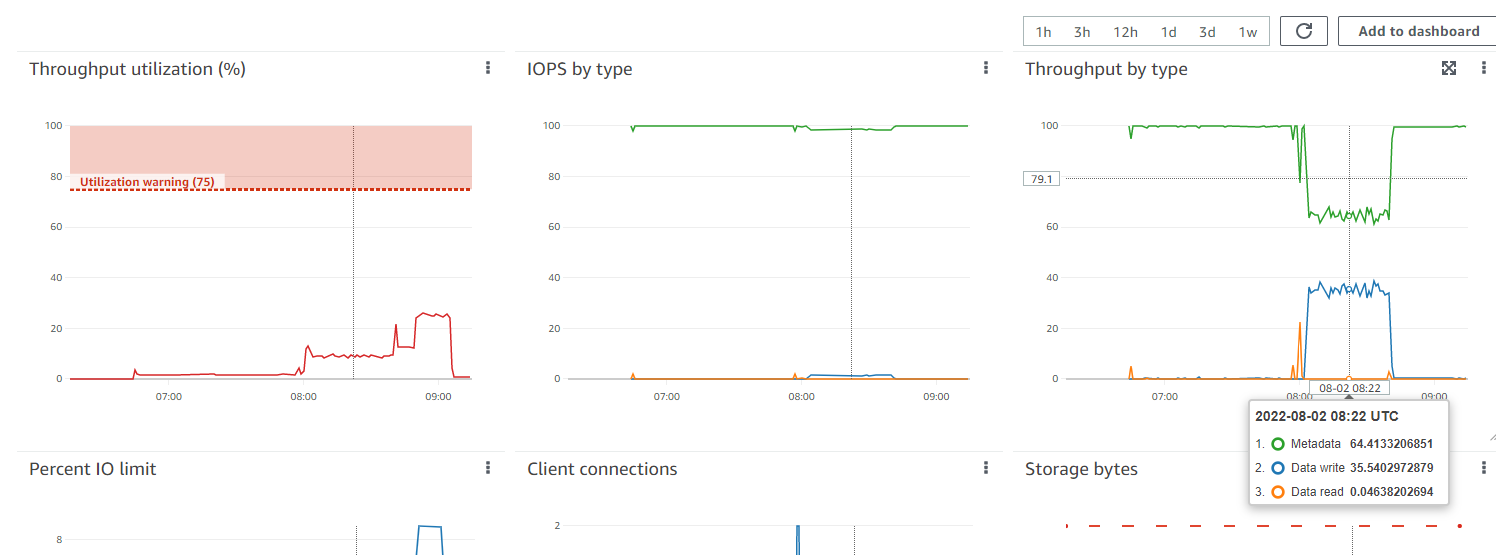
I thought that maybe we've reached the throughput limit(opens in new tab) of the file system and files came in way too slow, causing timeouts. However, this didn't make much sense because as it can bee seen on the screenshot above, the throughput utilization had barely reached ~25% at its peak.
Crossing off throughput as the issue, I wanted to see what was causing the unexpected spikes in EFS. Maybe there was a way to get something like a log file with all reads and writes to the filesystem, similar to the access.log file that nginx outputs. I asked on Server Fault(opens in new tab), but didn't get an answer, so I hacked my own logging functionality in the core Kirby helper class for reading and writing files.
It turned out that we were reading about 20 megabytes of data on each request. This was obviously very stupid and inefficient, but also extremely slow. Before the breaking update, we were reading around 5MB on each request, which was still a lot, but apparently not high enough to cause an issue.
So what was the issue? The increased data read could explain the EFS spikes, but at the same time, we didn't go beyond any limits.
Searching for information
Apparently, I was missing something, so I logged on one of the machines and started searching for information.
In /var/log/php-fpm.log, I found the following warnings:
WARNING: [pool www] seems busy (you may need to increase pm.start_servers, or pm.min/max_spare_servers), spawning 8 children, there are 0 idle, and 16 total children
WARNING: [pool www] seems busy (you may need to increase pm.start_servers, or pm.min/max_spare_servers), spawning 16 children, there are 0 idle, and 21 total children
WARNING: [pool www] seems busy (you may need to increase pm.start_servers, or pm.min/max_spare_servers), spawning 32 children, there are 1 idle, and 26 total children
WARNING: [pool www] seems busy (you may need to increase pm.start_servers, or pm.min/max_spare_servers), spawning 8 children, there are 0 idle, and 37 total children
WARNING: [pool www] seems busy (you may need to increase pm.start_servers, or pm.min/max_spare_servers), spawning 16 children, there are 0 idle, and 42 total children
WARNING: [pool www] seems busy (you may need to increase pm.start_servers, or pm.min/max_spare_servers), spawning 32 children, there are 0 idle, and 47 total children
WARNING: [pool www] server reached pm.max_children setting (50), consider raising it
The PHP docs about max_children(opens in new tab) state:
This option sets the limit on the number of simultaneous requests that will be served.
So it was becoming apparent where the bottleneck lied. We weren't hitting the EFS limits, but the compute limits of our servers.
In /var/log/nginx/error.log, I found the following error:
[error] 2887#2887: *11071 connect() to unix:/run/php-fpm/www.sock failed (11: Resource temporarily unavailable) while connecting to upstream…which could explain the 502 Bad Gateway errors — nginx was not being able to connect with PHP. There were also these errors:
[error] 2887#2887: *10898 upstream timed out (110: Connection timed out) while reading response header from upstream…which could explain the 504 Gateway Timeout errors — nginx could successfully connect, but then PHP took way too long to respond.
Doing the math
Once I looked closer at the Monitoring tab in Elastic Beanstalk(opens in new tab), things started to make sense. On average, we were getting around 2.5 seconds response time, while receiving about 2 requests per second. We were load balancing two servers, so each one was handling about 1 request per second. This meant:
  2 * 60 = 120 requests per minute
 120 / 2 = 60 requests per server
60 / 2.5 = 24 responses per minute
 60 / 24 = 2.5 request-response ratio
This 2.5 request-response ratio means that by the time 1 response is served, 2.5 new requests have come in. PHP responds to that by spawning more processes to handle the overwhelming load, until it reaches the maximum allowed processes, which in my case was 50. After that, it just refuses to accept any more requests and that's when the errors start.
What about auto-scaling?
Since we were using Elastic Beanstalk, it should have spawned more servers to handle the load, right? If we had 6 servers, rather than 2, we would've had:
  2 * 60 = 120 requests per minute
 120 / 6 = 20 requests per server
60 / 2.5 = 24 responses per minute
 20 / 24 = 0.83 request-response ratio
With a request-response ratio of less than 1, we'd be receiving requests at a lower rate than our response rate and everything would've been fine. So why didn't EB spawn more servers?
Well, from the perspective of Elastic Beanstalk, everything was going great. It had no reason to spawn any more servers, because our scaling metric was CPU utilization, and there was not a single threshold crossed. CPU load was indeed higher than usual, but not enough to be treated as a breach. The max_children setting was preventing that from happening, because PHP couldn't spawn enough processes to get the CPUs hot enough.
Solution
At first, we didn't know what was happening, so we manually spawned more servers in Elastic Beanstalk with the hopes of fixing the problem. It worked out, for reasons I've already explained. But after a while, the errors started popping up again, so we rolled back the breaking changes.
After discovering the 20MB per request thing and fixing it, our response times dropped from 2.5 seconds to around 0.5, so we removed the extra servers and everything was back to normal.
Conclusion
Bottlenecks are a lot harder to debug, compared to regular errors, because the code actually works and behaves as expected. They're harder to come across locally or on a staging server, because it's the load that's causing the problem, not the logic.
In those situations, data is your friend, and making sense of it is key. I was able to discover the problem thanks to a simple calculation, so I've made a server load calculator(opens in new tab) that allows you to easily do the same thing yourself.