How to Debug Browser Redirects
…without ruining your day.
Published on
-/- lines long
Redirects are bad for your website visitors because they result in excess HTTP requests which make pages load slower. Because they contribute to a bad user experience, your SEO will also suffer and you'll rank lower in Google Search.
Unfortunately, redirects can be tricky to debug because you instantly go to the destination URL, without much time to think about or even acknowledge what's happening.
Obtaining information is crucial, otherwise you're surrounded by uncertainty, nothing makes sense, and you get frustrated. Having more tools at your disposal gives you more options to test and leads you to a solution way faster and easier.
DevTools
The first tool I'd recommend is a tool you probably already have, and it's in its name — DevTools(opens in new tab). It can be useful for a lot of things, redirects included:
-
Open DevTools with
Ctrl + Shift + Ion Windows andCmd + Option + Ion Mac (or using one of the other ways(opens in new tab)). -
Toggle the "Network" panel.
-
Check "Disable cache"(opens in new tab), so that browser caching is disabled and doesn't interfere with your changes.
-
Optionally check "Preserve log"(opens in new tab) as well, so that request logs are not getting cleared upon page refresh.
-
Optionally filter requests by type(opens in new tab) "Doc", meaning that only HTML document requests are shown, which represent the initial request for a page.
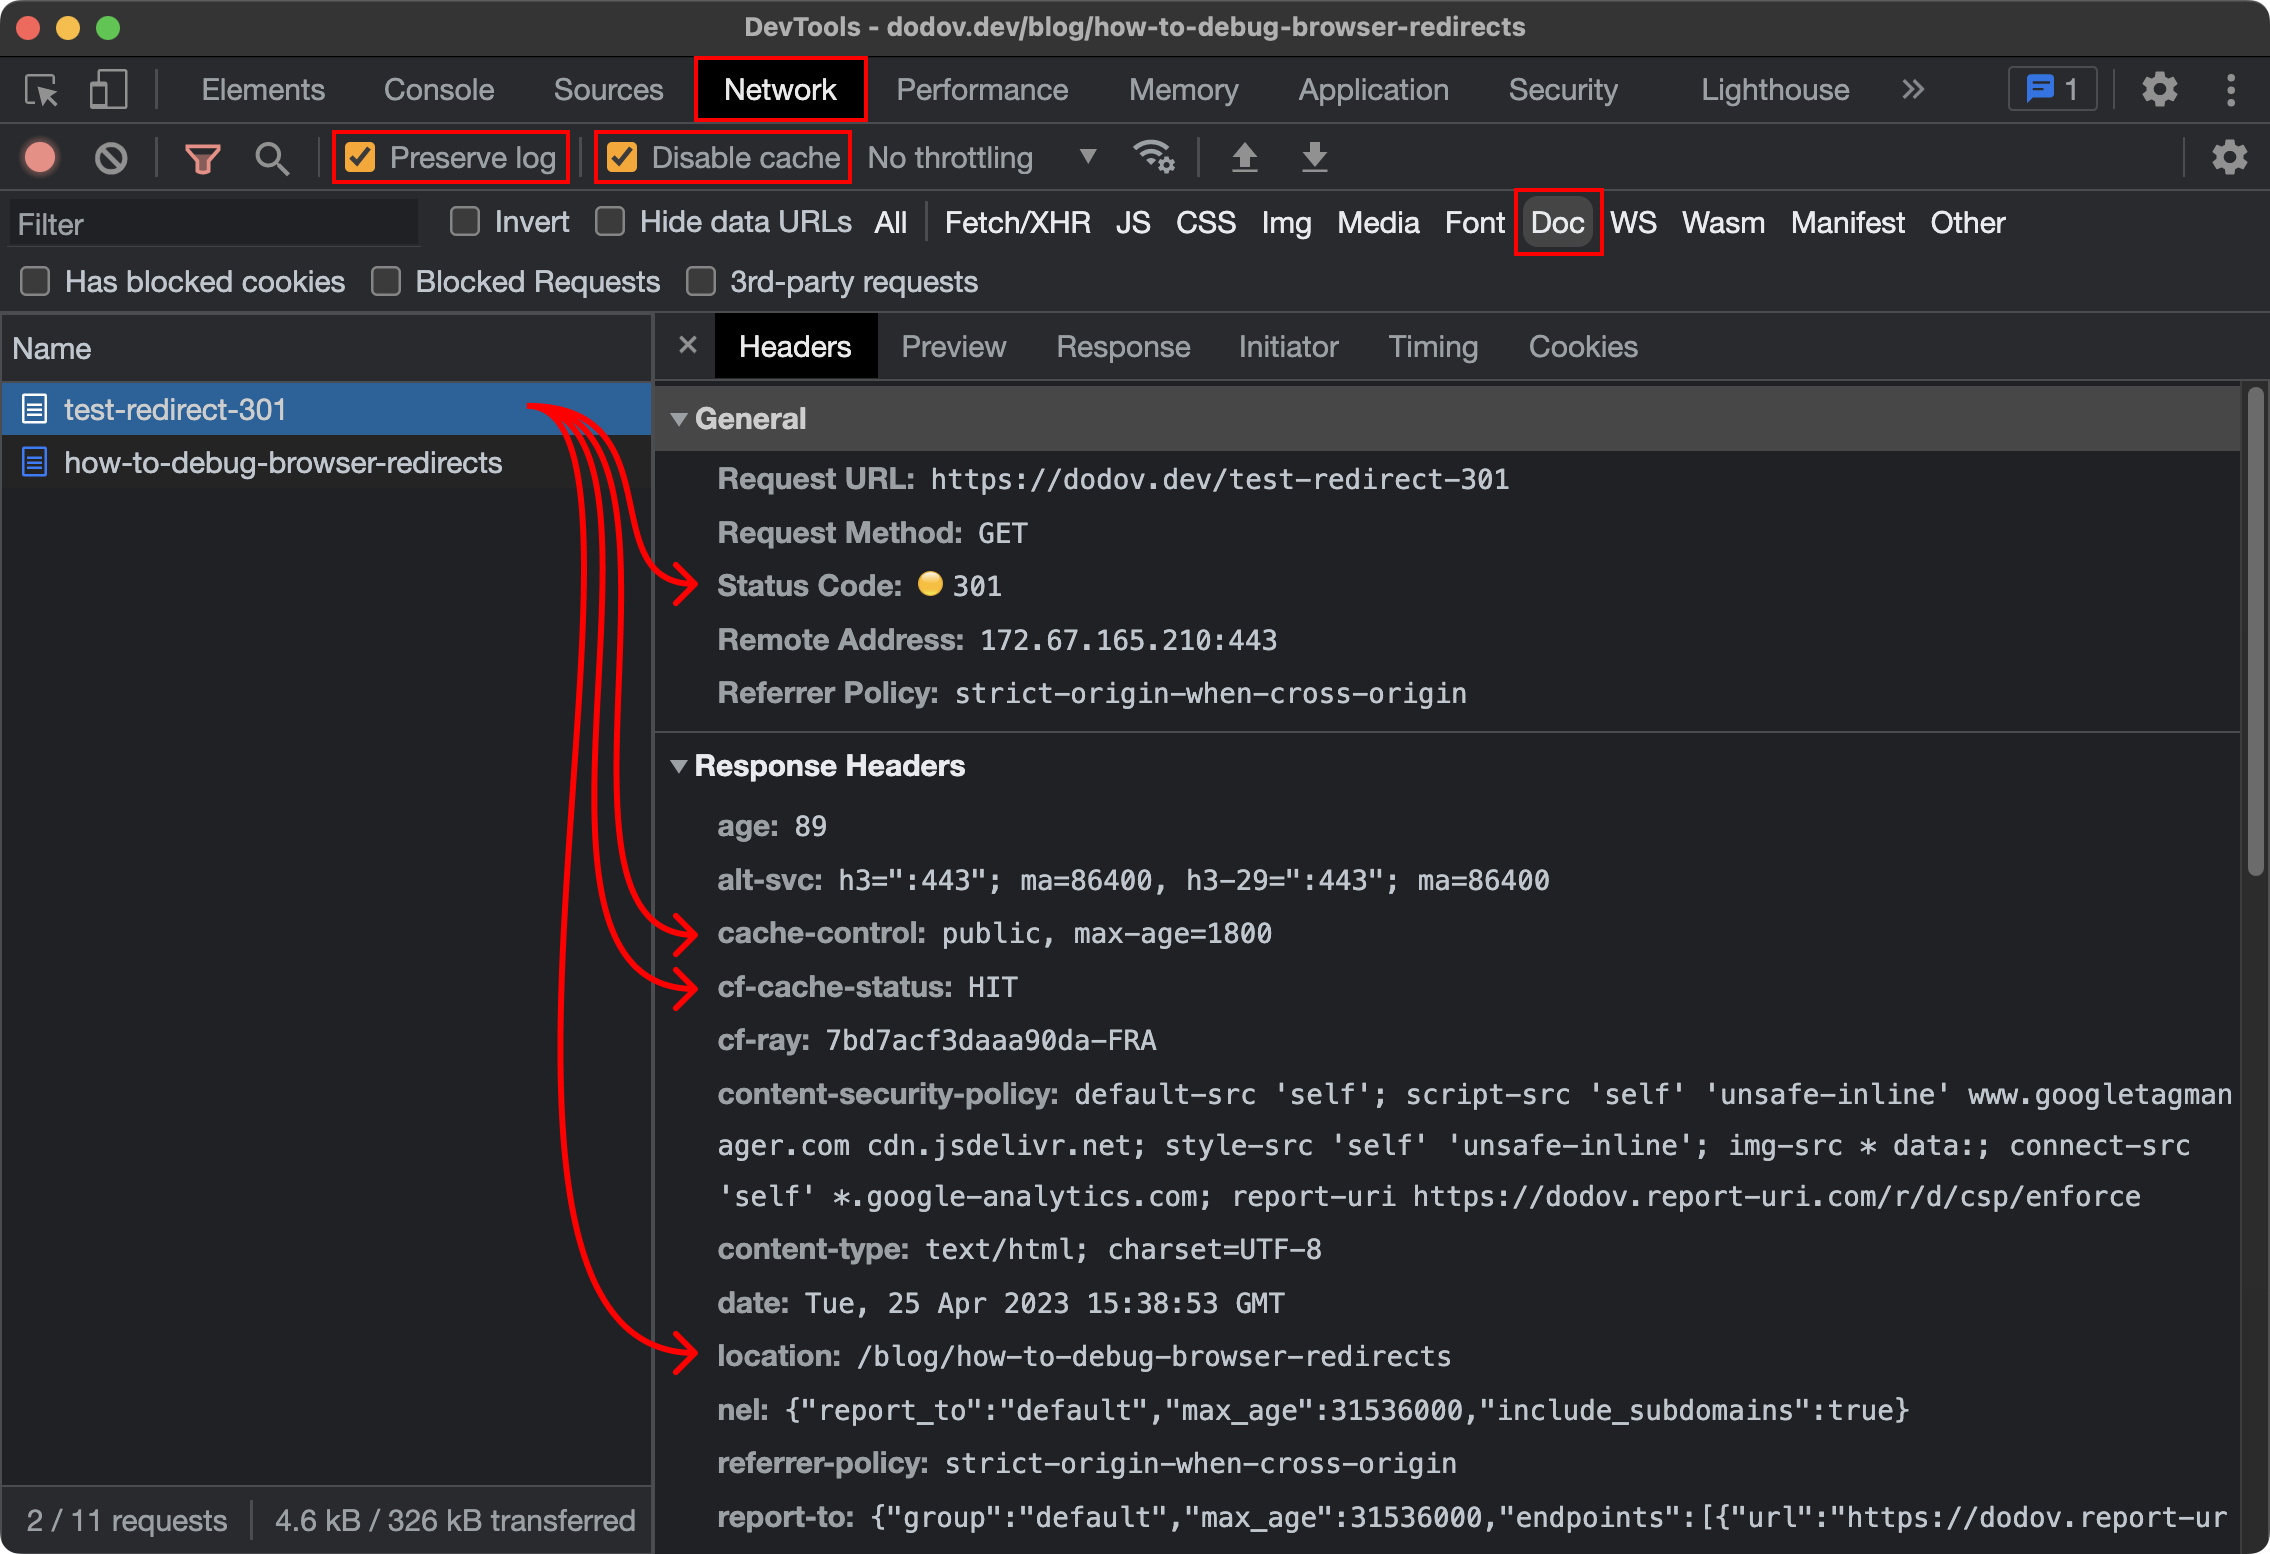
As you can see, DevTools provides very useful information about the request that resulted in a redirect:
-
HTTP status code(opens in new tab) — whether it was a 301 redirect, 302, etc.
-
Cache-Controlheader(opens in new tab) — whether the browser should cache the request, how, and for how long -
CF-Cache-Statusheader(opens in new tab) — whether the response has been cached by Cloudflare(opens in new tab) and how -
Locationheader(opens in new tab) — the destination URL of the redirect
If you've fixed the problem, but it just "won't work", then you might be facing a caching issue and my explanation for browser cache and edge cache(opens in new tab) could help you understand what's going on.
It's also important to note that browsers have special, more aggressive caching behavior when it comes to 301 redirects, as explained in this Stack Overflow answer(opens in new tab):
In the absense of cache control directives that specify otherwise, a 301 redirect defaults to being cached without any expiry date.
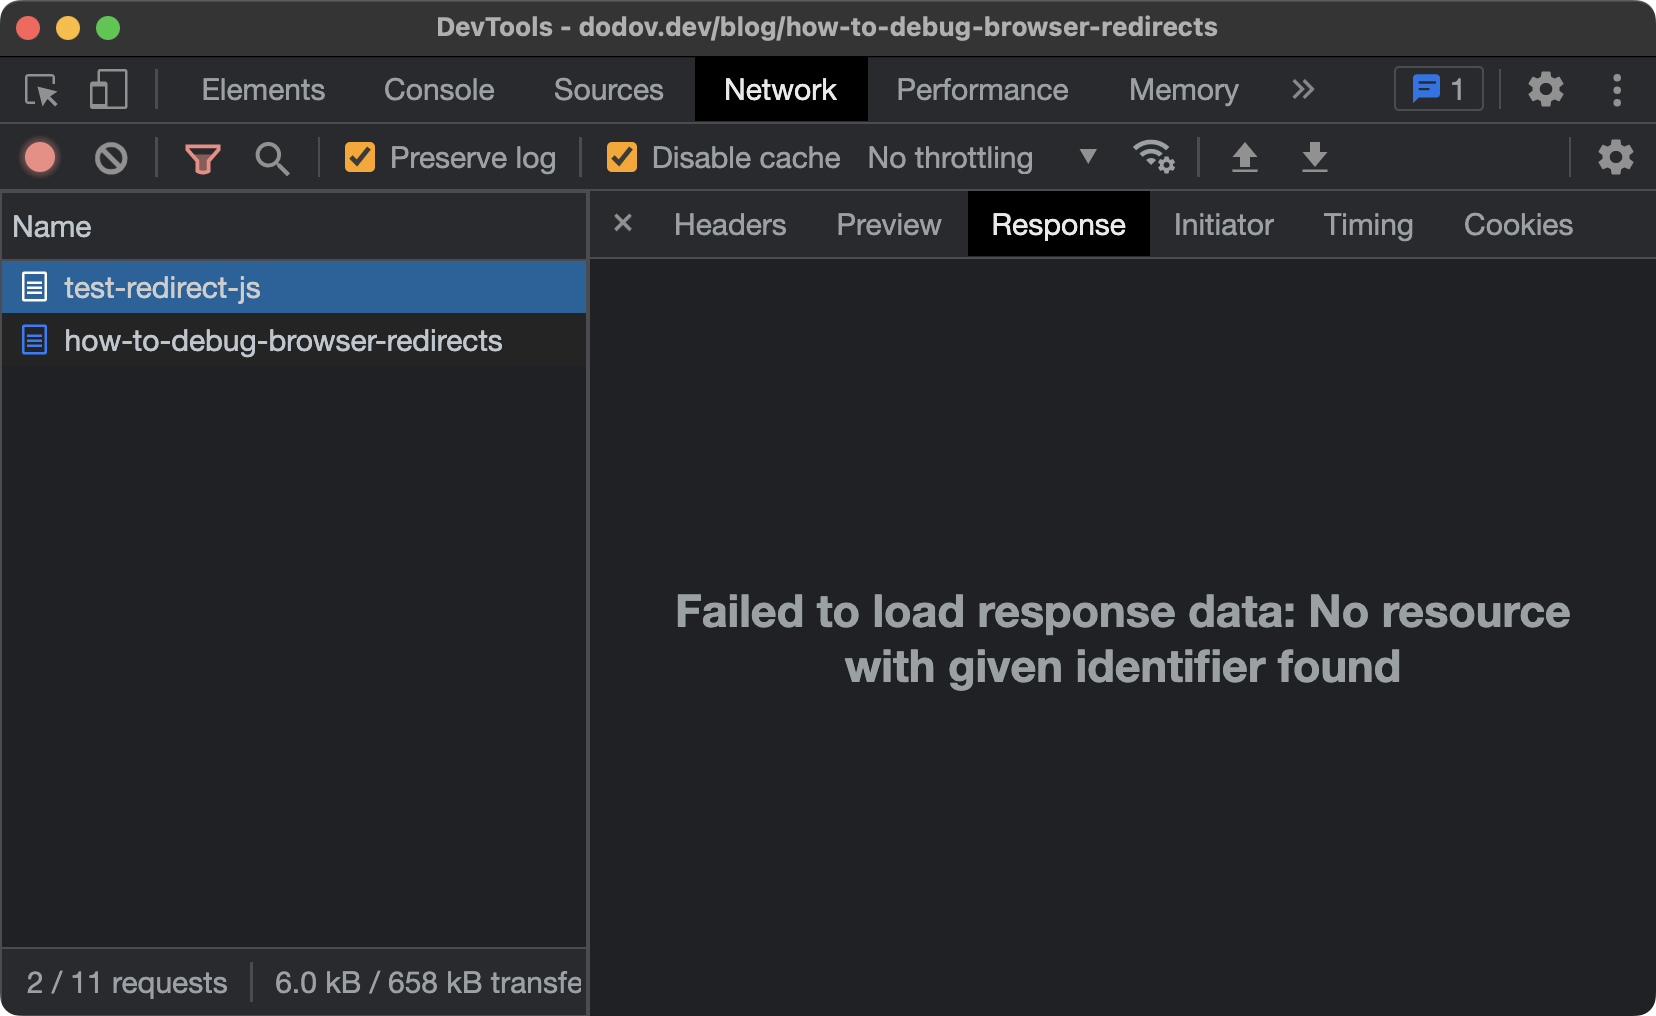
Where DevTools falls short, however, is when you're dealing with a client-side JavaScript redirect(opens in new tab). DevTools won't keep the HTML document body upon landing on the destination URL and you won't be able to inspect the JavaScript of the page in question to figure out what happened. Despite having the "Preserve log" setting enabled, DevTools still won't capture the body:
To get around that, you could prefix the problematic URL with view-source: in your browser's address bar and hit "Enter". This will display the HTML of the page, but without rendering it (and without executing the scripts inside):
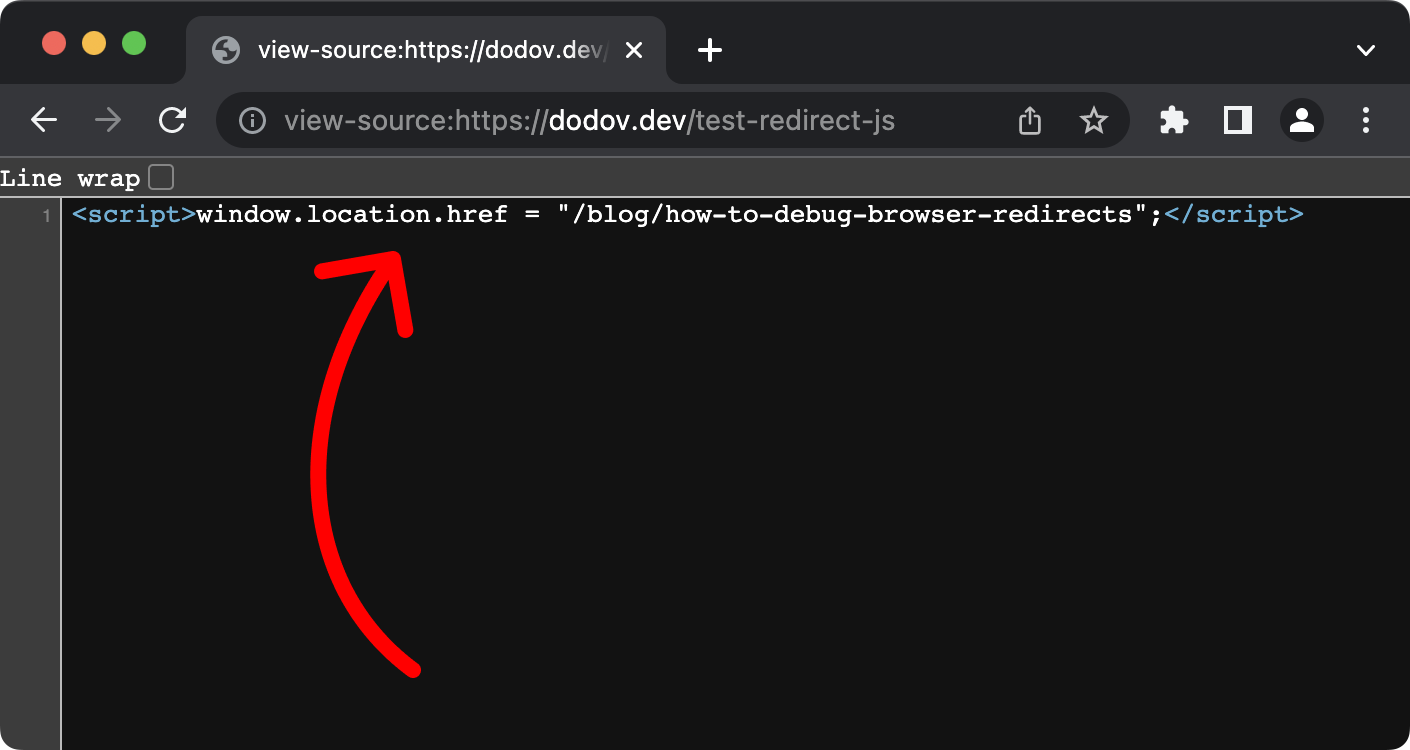
view-source screenNow, you can see the script that causes the redirect. The above example is very minimal and obvious, however. In the real world, the actual line of JavaScript that redirects might be hidden in externally loaded scripts, so you'd have to search those as well.
Browser Extension
Using DevTools and view-source is useful when you have a concrete issue that you want to resolve. But redirects happen so quickly that sometimes you might not even notice that something had happened at all. And how likely is it that you'll casually be viewing requests in DevTools and looking at their status codes…
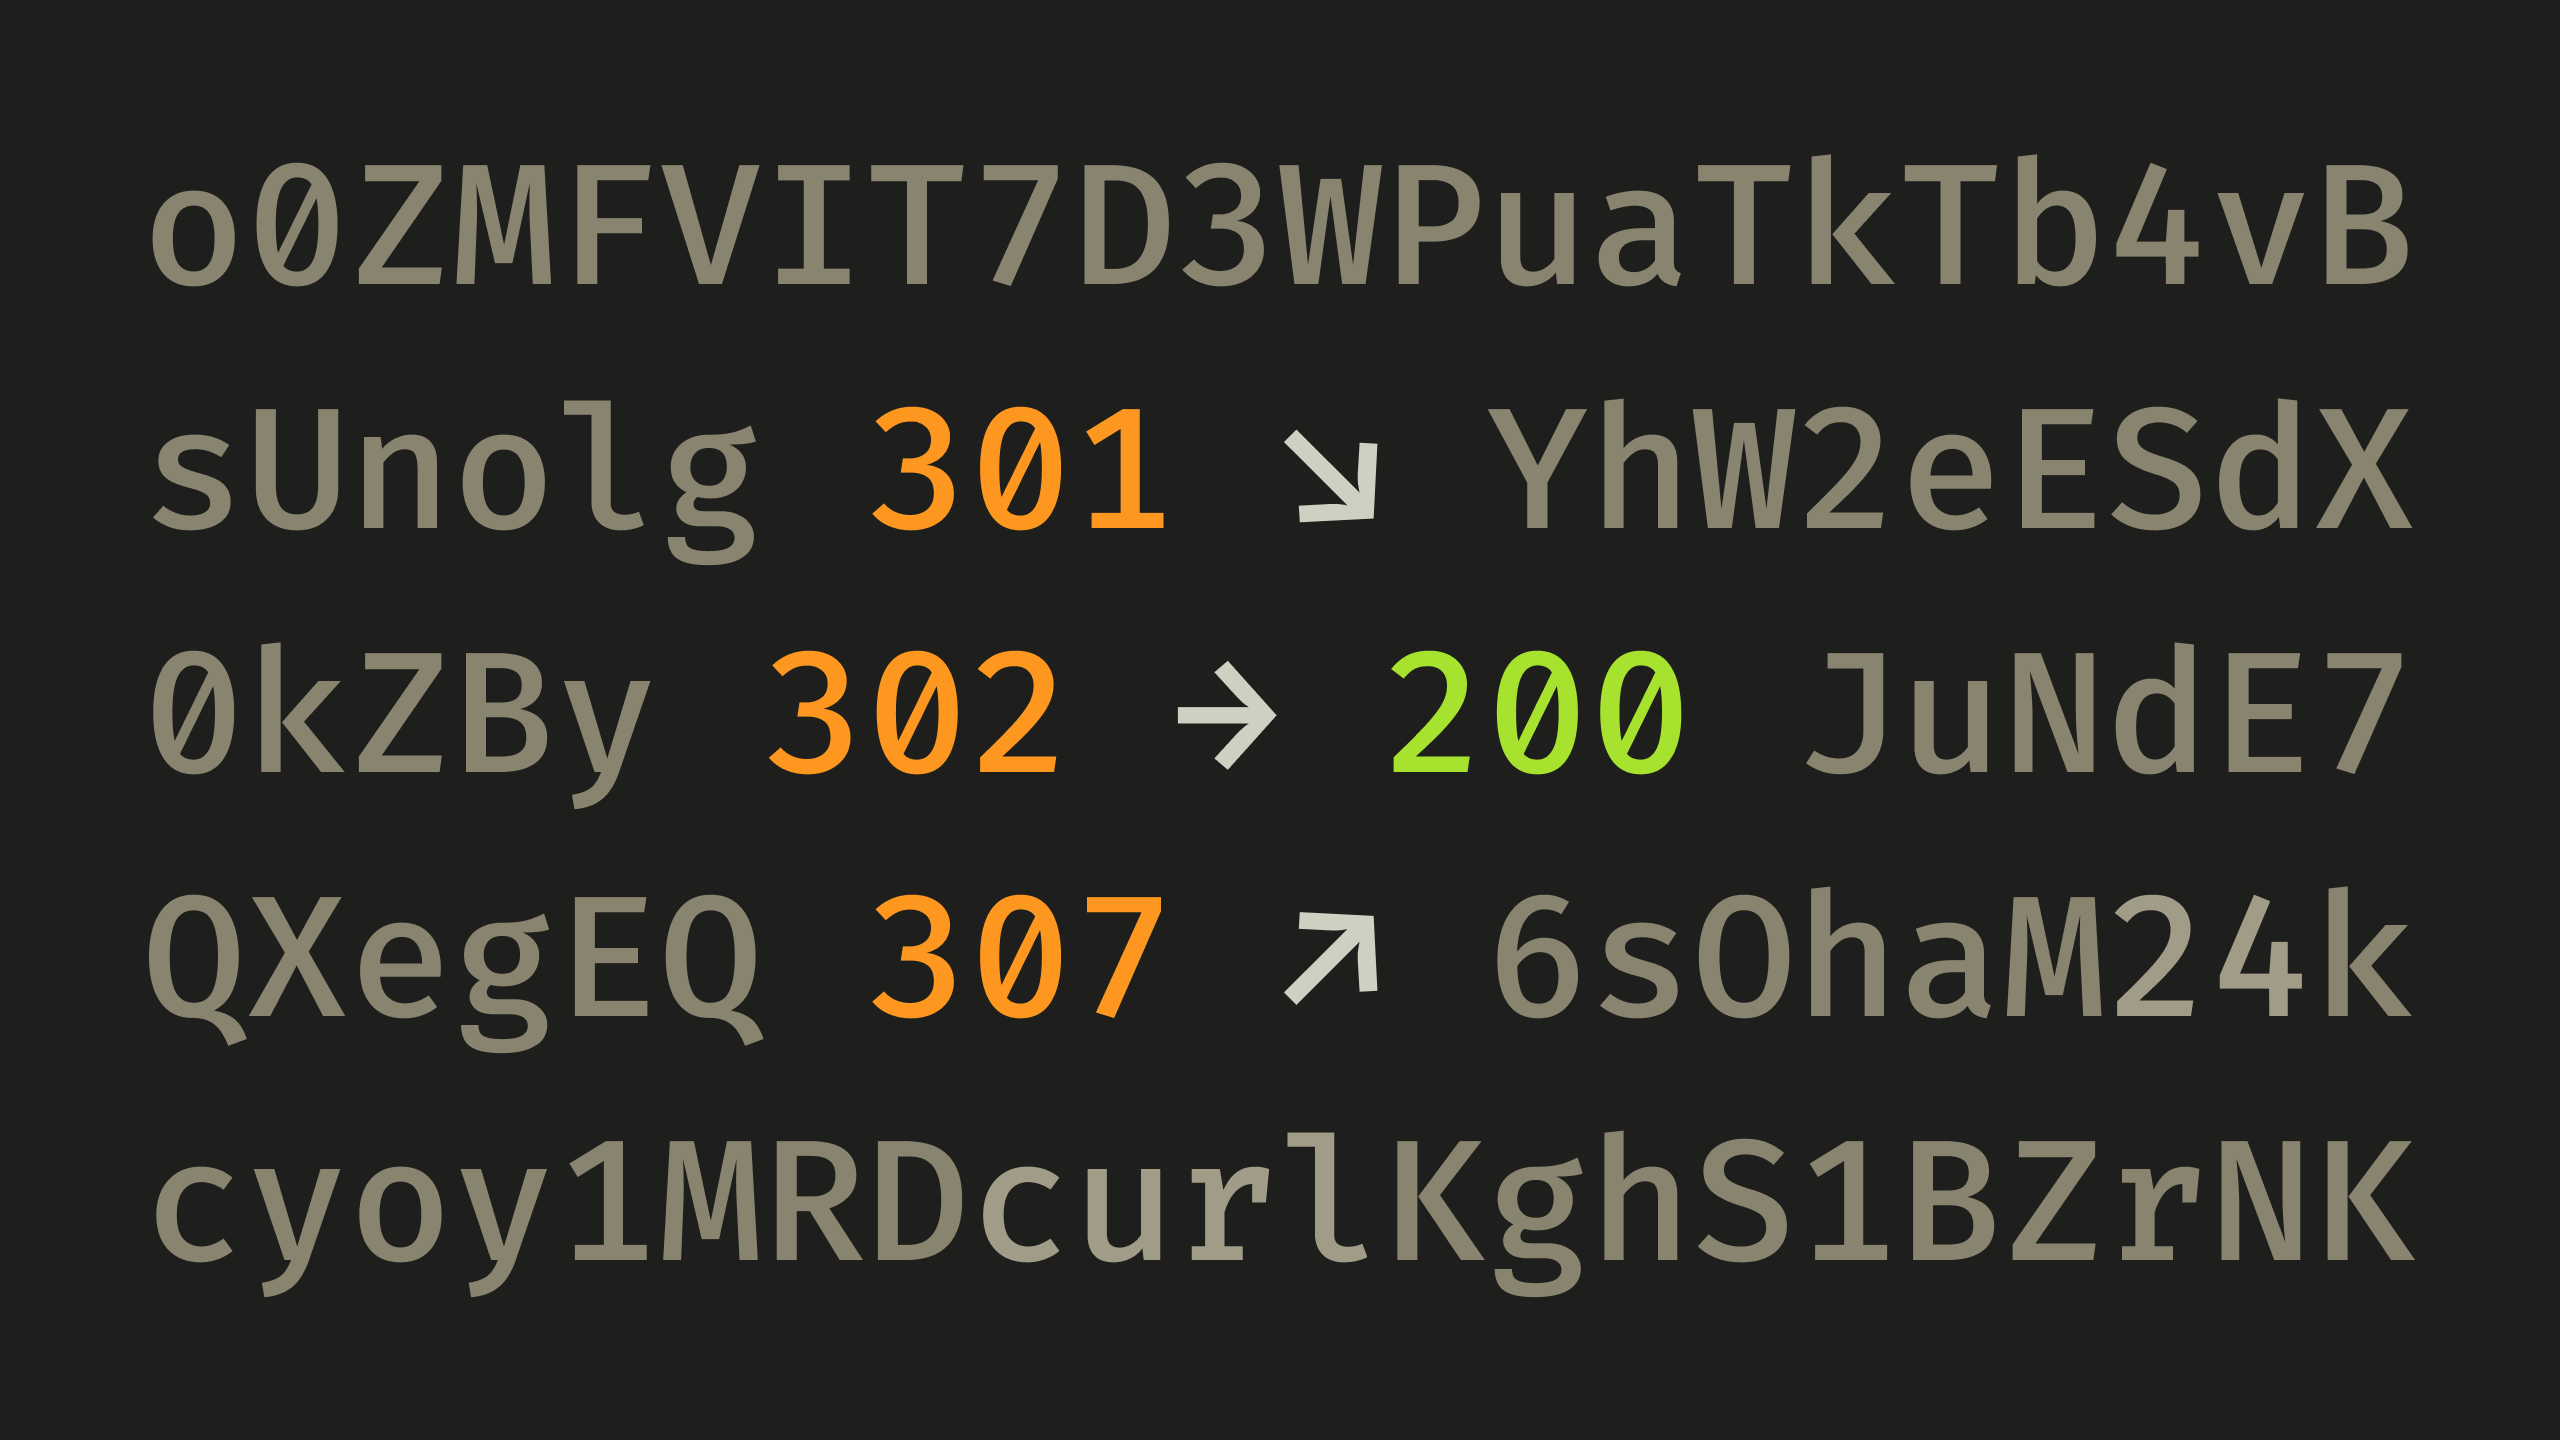
This is where the Link Redirect Trace(opens in new tab) browser extension can help you out. When you navigate to a page, it keeps track of all redirects that occurred during the process, allowing you to see the chain of events:
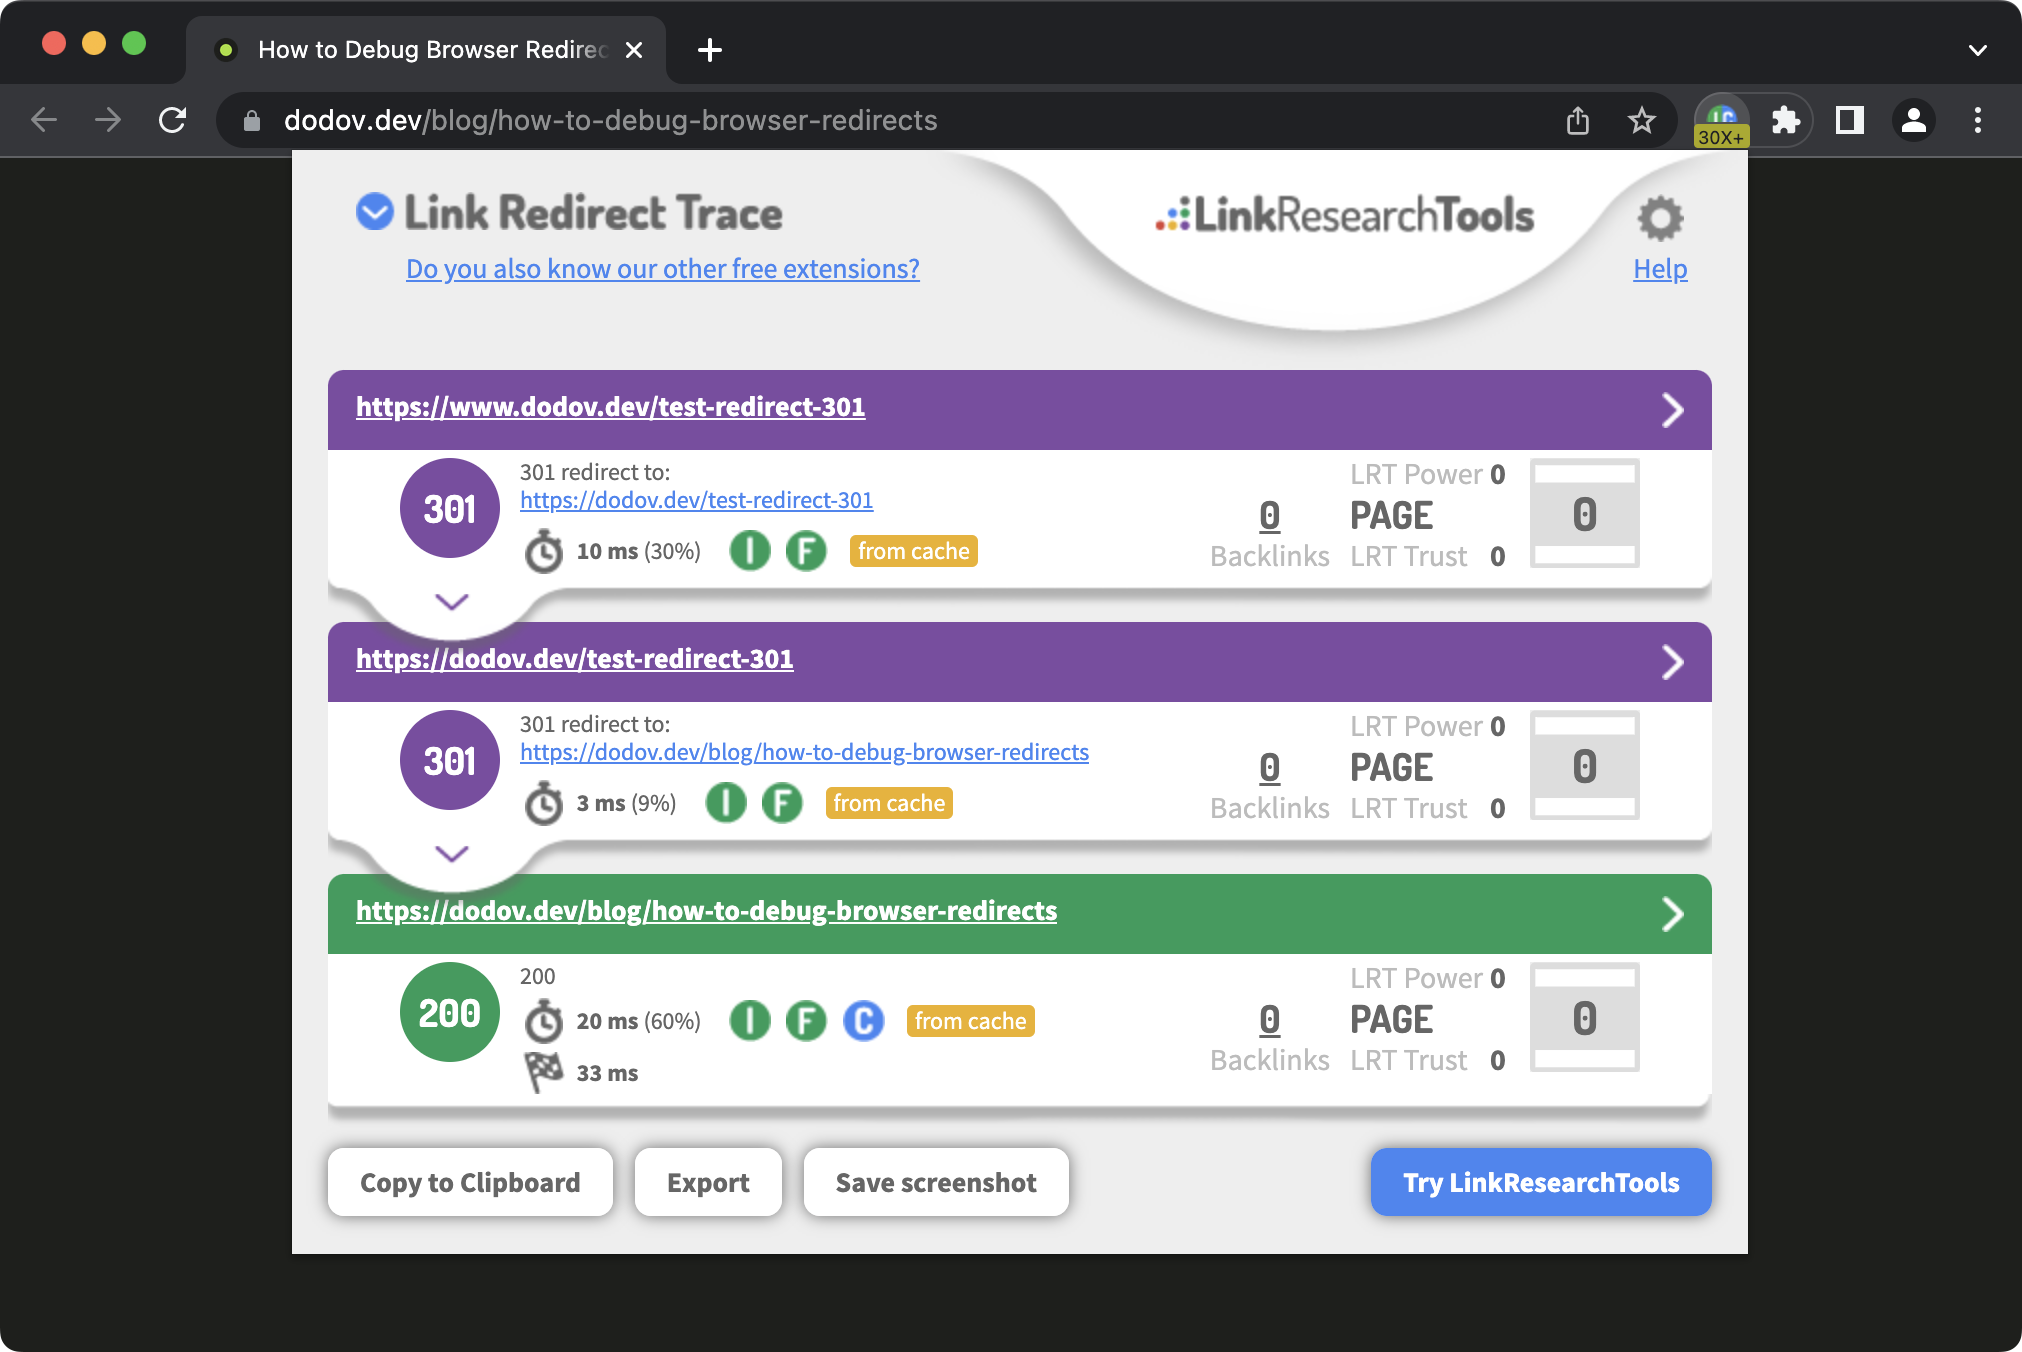
The cool thing is that it will also display any redirects that may have occurred as you casually browse the site. All you have to do is to glance over at the extension's badge and see if it displays anything other than "200":
cURL
Using the browser can lengthen the feedback loop while fixing something — you need to make the change, switch to the browser, refresh the page… and you might also forget to disable the browser cache, which can confuse you tremendously.
For this reason, you can use the cURL(opens in new tab) program. It does just a single job — make a request and print out a response. It's quick, does not have caching mechanisms (like the browser), and runs in the terminal, which is likely already by your side while working.
Using the -i flag, you can print the full response of a request:
curl -i https://dodov.dev/test-redirect-jsHTTP/2 200
date: Sat, 29 Apr 2023 05:51:51 GMT
cache-control: public, max-age=1800
last-modified: Sat, 29 Apr 2023 05:50:22 GMT
cf-cache-status: HIT
<script>window.location.href = "/blog/how-to-debug-browser-redirects";</script>As you can see, you get everything valuable in one place — the HTTP status code, the headers, and the body. You could also very easily rerun the command again and see the potential changes.
Note: I've removed some of the response headers in these examples because they're not relevant to what we're talking about.
Here's what we get for a 301 redirect:
curl -i https://dodov.dev/test-redirect-301HTTP/2 301
date: Sat, 29 Apr 2023 06:01:30 GMT
cache-control: public, max-age=1800
location: /blog/how-to-debug-browser-redirects
cf-cache-status: HITThis time, the HTTP status code is 301, rather than 200, and instead of a response body with a script tag, we get a location header that determines the URL destination.
Printing only headers
By default, cURL returns the response body and the -i flag makes it include the response headers as well. But unless you're dealing with a JavaScript redirect, you'll only want to be looking at the headers and the response body would do nothing more than to clutter your terminal.
To print out just the headers with cURL, you have to use the -I flag (note that it's capital "I", not -i), which only prints out the document info (headers). However, this also changes the request method to HEAD(opens in new tab), and the browser issues GET requests for HTML documents, so it makes sense to use the -X flag as well and execute a GET request instead:
curl -I -X GET https://example.com/Copy as cURL
There's a quick and easy way to transition from testing redirects in the browser to testing them with cURL. You can right-click on a request in the "Network" panel, then click "Copy as cURL":
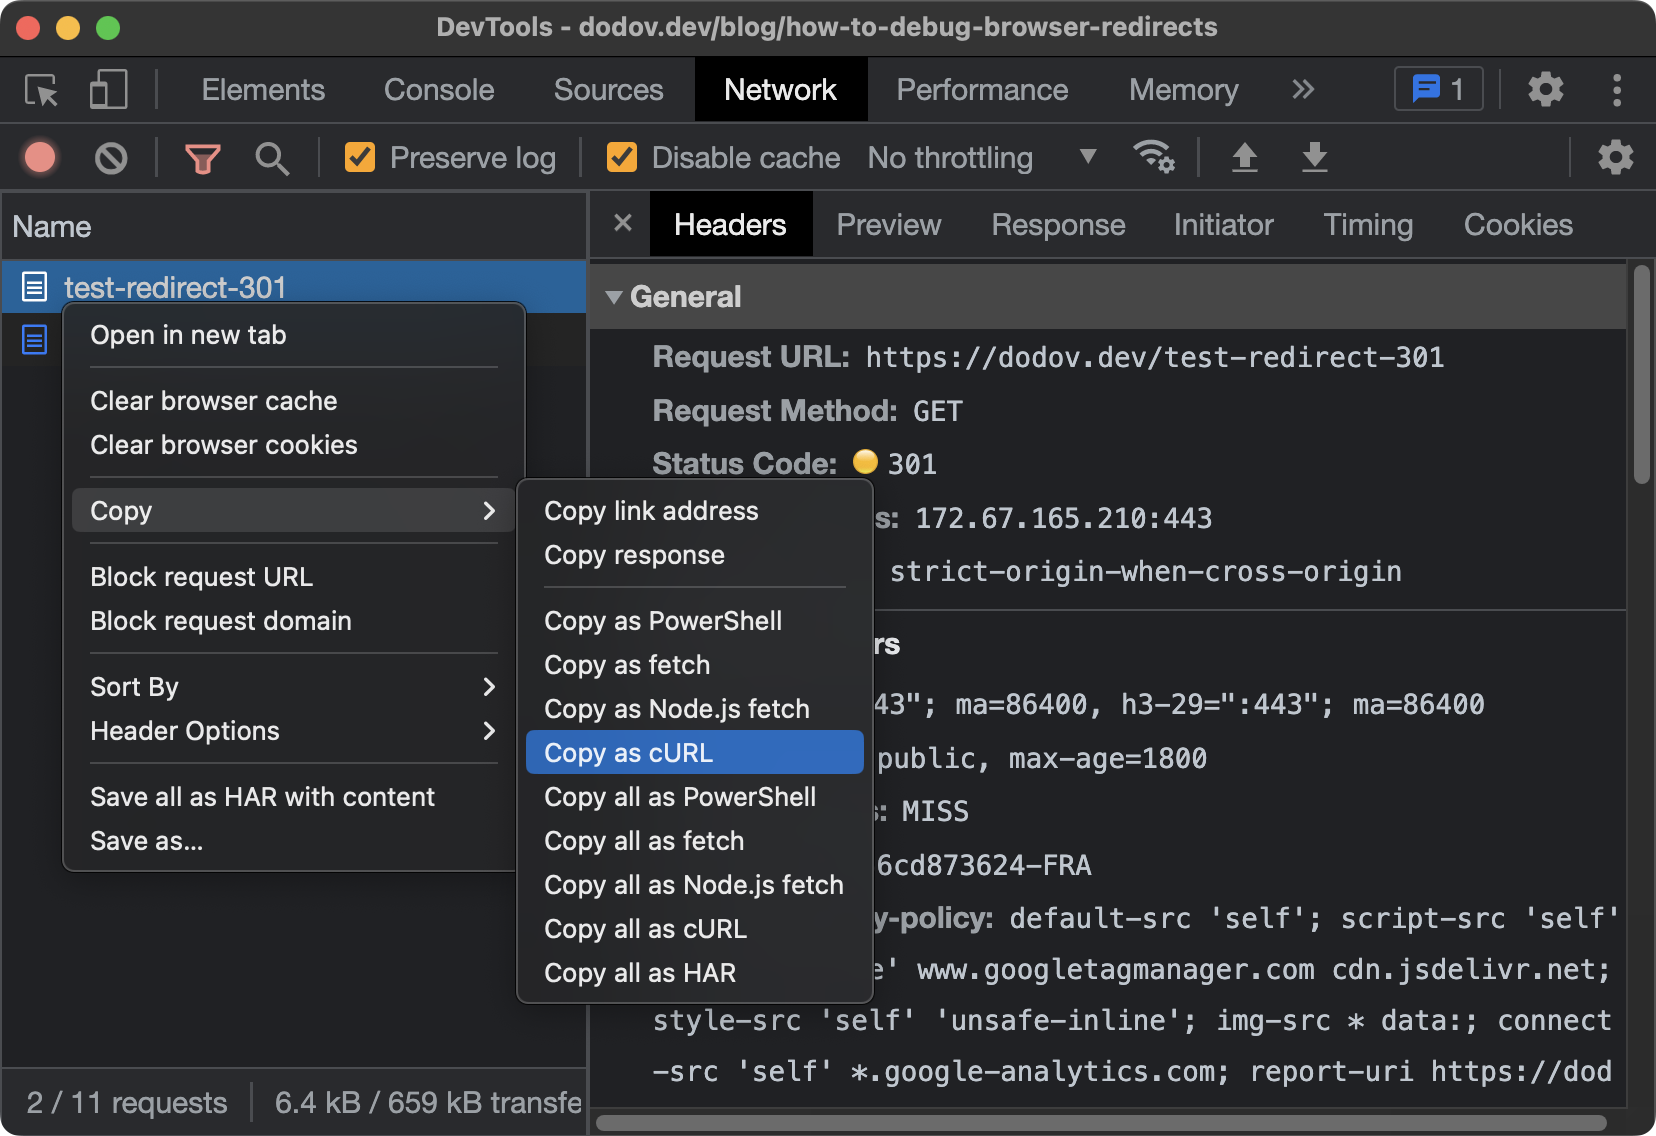
After that, you'd be able to paste a cURL command which issues a request that is identical to the one the browser would send, with all of the appropriate headers:
curl 'https://dodov.dev/test-redirect-301' \
  -H 'authority: dodov.dev' \
  -H 'accept: text/html,application/xhtml+xml,application/xml;q=0.9,image/avif,image/webp,image/apng,*/*;q=0.8,application/signed-exchange;v=b3;q=0.7' \
  -H 'accept-language: en-US,en;q=0.9' \
  -H 'cache-control: no-cache' \
  -H 'cookie: _ga=GA1.1.236846401.1677490962; _ga_6LMHZGGEMZ=GS1.1.1682655158.6.0.1682655162.0.0.0' \
  -H 'pragma: no-cache' \
  -H 'sec-ch-ua: "Chromium";v="112", "Google Chrome";v="112", "Not:A-Brand";v="99"' \
  -H 'sec-ch-ua-mobile: ?0' \
  -H 'sec-ch-ua-platform: "macOS"' \
  -H 'sec-fetch-dest: document' \
  -H 'sec-fetch-mode: navigate' \
  -H 'sec-fetch-site: none' \
  -H 'sec-fetch-user: ?1' \
  -H 'upgrade-insecure-requests: 1' \
  -H 'user-agent: Mozilla/5.0 (Macintosh; Intel Mac OS X 10_15_7) AppleWebKit/537.36 (KHTML, like Gecko) Chrome/112.0.0.0 Safari/537.36' \
  --compressed
This is really useful, because you can comment out or change various headers and see how that would affect the reponse. You basically can't do that in the browser at all.
Conclusion
Redirects are important because they negatively impact user experience and SEO. They're also tricky to discover and debug because they're subtle and instantaneous. But with the right tools, you can catch and fix them quite easily:
-
Use Link Redirect Trace(opens in new tab) to spontaneously find redirects and get a quick overview of what had happened
-
Use DevTools(opens in new tab) to get more advanced details about the requests, such as the headers
-
Use cURL(opens in new tab) to get in the weeds and experiment more freely and rapidly, while avoiding cache pitfalls
No matter what you use, make sure you always test in the browser as well when you're done. That's where your users are.
If you found that useful, you can tune in to my upcoming advices and suggestions by following me on Twitter(opens in new tab) or LinkedIn(opens in new tab).